This is an alpha test version of the still under construction VE3SUN Beacon Observer program. I have been developing this program in randomly grabbed chunks of time for the past few months. At this point, the program is more a collection of ideas and tests than a carefully architected bullet proof application. On the other hand, it is functional, and I am sure you will soon report on the bugs and desirable new features to add. Once complete, the program will be capable of uploading the final observed beacons page to the International Beacon Project web site and/or make it available for P2P download by interested amateurs.
The program is designed to monitor the 18 beacons in the International Beacon Project chain 24 hours a day. Every 15 minutes, the entire sequence of 18 beacons on 5 bands is checked. A waterfall chart of signal strength vs time is kept at one second intervals and can be displayed simply by clicking on one or more of the charts.
At this point, I won't be able to work on the program for the next few weeks, so I thought it would be a good time to let a few more people try it out to collect bugs and make suggestions. The program is written in Delphi 4 and uses AE4JY’s PSKCore DLL for the interface to the sound card and the FFT calculation. These instructions are rough and preliminary. Please report errors or help me write better ones. I am willing to share source code with programmers who wish to extend or work on the project.
The program has not been optimized in any way so it requires a reasonably fast machine with a lot of memory. Probably at least a Pentium 266 and 256 megabytes of memory.
Installation
Setup
The program has to run for a beacon or two to initialize many of the settings. Let it accumulate a little data before testing the features.
If you move your mouse over different parts of the window, hints will pop up. There are many possible right and left mouse click options that are not obvious in this prototype application. Experiment a little.
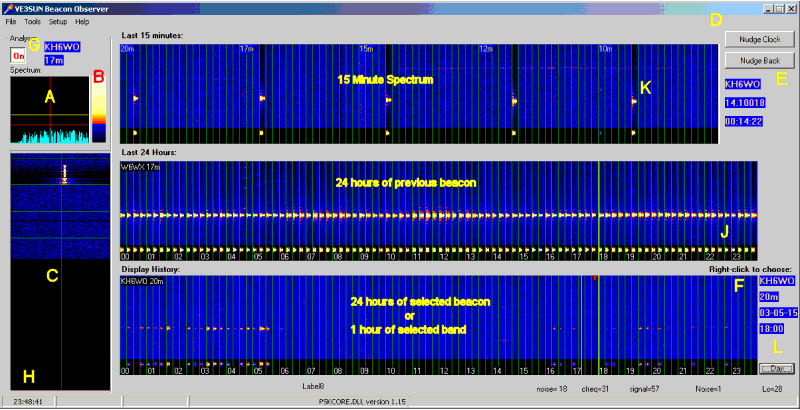
Display A shows the real time signal strength every .25 seconds over an audio frequency range from about 400 to 800 Hz. The color legend B shows the color that will be recorded for the strength of a given signal. Automatic Color Control (selected under Tools) will cause the levels to be adjusted up and down according to background noise. This adjustment occurs slowly and is remembered for each band.
If Automatic Color Control is off, the levels can be adjusted manually by left or right clicking on panel A. Left clicking sets the blue/red threshhold. Right clicking sets the red/yellow threshhold. In this prototype it is possible to cause errors by selecting inappropriate levels. Always set the red/yellow higher than the blue/red.
Waterfall plot C shows the quarter second signal strength by time. Beacon windows are indicated. If your computer clock is drifting, you can nudge it with the buttons D, which will nudge the clock one second forward or back. This is not necessary if automatic clock adjustment is working. A future version of this program will use the beacon signal itself for timing. GPS timing is also under development for even more accurate clock setting.
Plot K shows the received signal for 15 minutes. The time required to hear all the beacons on all 5 bands. The plot loops, retaining the latest 15 minutes at all times. Moving the cursor over the plot will cause the display panels E to indicate the beacon, time, and frequency shown. The last digits of frequency are not calibrated at this time. Future versions will allow you to use different sidetone frequencies and will be calibrated to exact frequency display. For now, you should use 600 Hz sidetone or adjust the radio setup commands for each band.
The middle panel shows the last 24 hours of the beacon which has just finished transmitting for comparison purposes. The bottom of the plot shows the interpreted beacon signal based on the signal strength. This is an excerpt of the strongest signal in the 10 second period, gated by an algorithm which attempts to avoid false triggering. For now, the algorithm is a signal in seconds 1,2, and 3 on a given frequency and no signal in second 9 on that frequency.
Clicking on a point in the top panel will bring up the lower history display which can be 24 hours of one beacon, or 75 minutes of one band. The location of the click in the top window determines what is shown in the bottom window. Use the legend at the right to see what you are clicking on.
The History plot at the bottom can be scrolled by clicking at the left or right end. At the left you are scrolling down. On the right you are scrolling up. Clicking with the left mouse button moves through the list of beacons on the same band. Holding the Shift key down while clicking scrolls through the bands for the same beacon.
Right clicking brings up a menu choice of showing the beacon for 24 hours or the band for 75 minutes. If you select band, then you can left click at the left or right of the display to scroll through time on one band and look at the QRM or determine if a beacon has been falsely recorded.
You can right click the callsign or band at the right to select a beacon or band directly.
Click the Day button to bring up a summary of 24 hours of beacon listening.
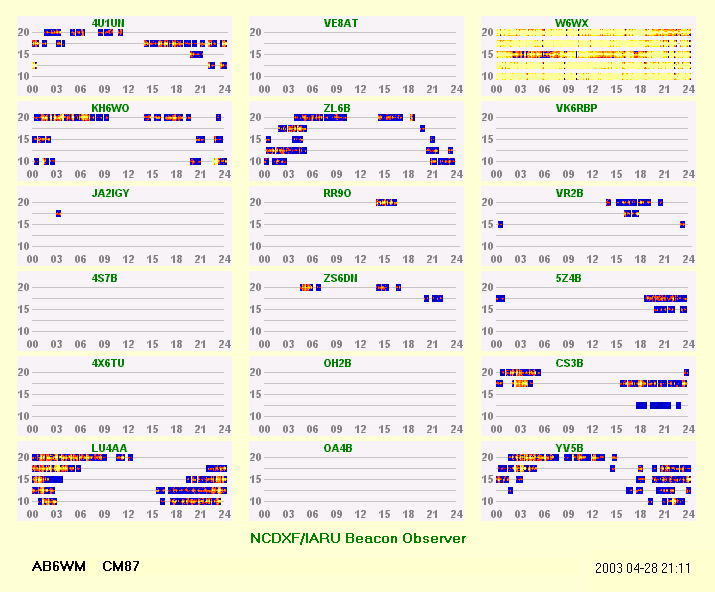
This window displays the summary of beacon signals received over a 24 hour period on 5 bands. The color represents the strength of the beacon signal. This is a copy of the center portion of the plot from the first window. Currently, the algorithm to determine whether a signal is a beacon or QRM is quite simplistic. The next version will incorporate correlation of the morse code identification of the beacon for better accuracy.
The display is live. Clicking on a point will display that received signal in the bottom panel of the main window. 24 hours of the selected beacon on the selected band is shown. A little red flag highlights the observation time selected. This makes it easy to judge whether the signal was really a beacon or some QRM on the frequency. Or vice versa, whether some QRM caused a false negative report.
It is possible to edit the 24 hour display using the INS and DEL keys to insert or delete a single point.
Right clicking on any point will bring up a menu which allows you to display the beacon or the band at the selected time and frequency. The menu also has the choice of clearing all spots from a given beacon if it known not to be operating.
The caption at the bottom of the chart can be edited using the Edit menu.
FAQ
Ask away.
Known Problems and incomplete Functions
The initialization string in the radio setup has not been implemented yet. It does nothing.
Inappropriate color level selection causes divide by zero and other errors.
The program must be running from 2400Z to 0015Z in order to move the history from one day to the next.
Audio recording is not implemented. Eventually, clicking on a plot will play the recording of that time.
Report problems or offer suggestions to the author.